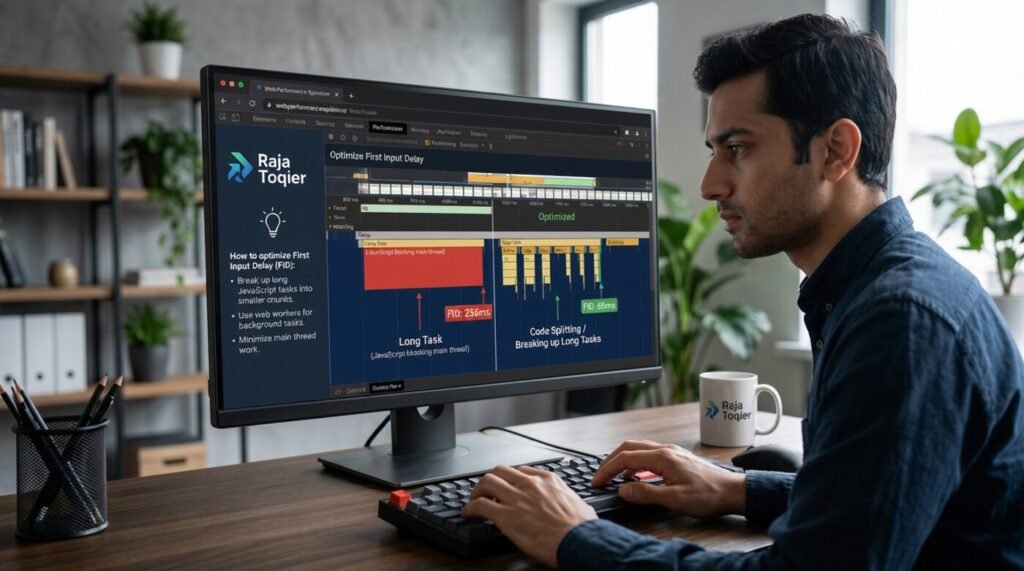
What Is First Input Delay (FID) and Why It Still Shapes Interactivity in 2026
First Input Delay (FID) measures the time between a visitor’s first interaction with a page – a tap, click, or keystroke – and the moment the browser is free to respond to it. Google introduced it in 2020 as the first Core Web Vital to capture real-user responsiveness instead of a lab-only score, but officially deprecated it in favor of Interaction to Next Paint (INP) on March 12, 2024. Optimizing FID still means the same thing it always did – minimizing JavaScript execution time and chunking long tasks off the main thread – but every fix below is written against the metric that replaced it: INP.
Key Takeaways
- FID is deprecated – Google replaced it with Interaction to Next Paint (INP) in March 2024, and the good threshold to chase now is INP under 200ms at the 75th percentile.
- Five techniques fix most interactivity problems: breaking up long tasks, reducing JS execution time, optimizing interaction readiness, debouncing/throttling, and offloading work to web workers.
- Layout thrashing and unoptimized hydration in React/Next.js and other SSR frameworks are common hidden causes of poor scores, even after the obvious JS fixes are done.
- Measure at the 75th percentile, not the average – that’s the number Google actually scores, and it’s what surfaces the slow-device, slow-connection users who need the fix most.
Why FID Optimization Matters for AI Search, Not Just Google Rankings
Optimizing FID used to be a rankings play. Now it doubles as an AI-visibility play, since the same signals that satisfy Google’s Core Web Vitals also determine whether an AI Overview or chatbot lifts your page into its answer. Here’s how the two scorecards compare:
| Traditional SEO Indicator | Next-Gen GEO/AIO Benchmark |
|---|---|
| PageSpeed score (0-100) | INP under 200ms at the 75th percentile |
| Keyword density | Exact-phrase answer blocks for AI Overview extraction |
| Backlink count | Entity coverage / topical completeness across the query cluster |
| Meta description CTR | Featured-snippet and AI Overview citation rate |
| Time on page | Extraction-readiness (tables, numbered steps AI can lift verbatim) |
The technical fixes below move both scorecards at once – but it’s worth measuring against both, not just the legacy one.
FID vs. INP: How Google’s Metric Shift Changes Your Optimization Priorities
FID only ever scored the first interaction on a page, which meant a site could pass with flying colors and still feel sluggish on the fifth click. Interaction to Next Paint fixed that blind spot by scoring the slowest interaction across an entire visit, so the optimization target moved from a single fast first click to consistent responsiveness for as long as a visitor stays on the page.
The Three-Part Anatomy of INP – Input Delay, Processing Delay, and Presentational Delay
- Input Delay is the gap between the moment the user interacts with a web page and the browser’s first opportunity to execute any event handlers, caused by other tasks already queued on the main thread.
- Processing Delay – the time the browser spends actually executing the event handler’s JavaScript logic.
- Presentational Delay – the time between processing finishing and the browser painting the next visual frame to the screen.
FID vs. TBT vs. INP: A Side-by-Side Comparison Table
| Metric | What It Measures | Good Threshold (75th %ile) | Status |
|---|---|---|---|
| FID (First Input Delay) | Delay before the browser responds to the very first user interaction | < 100 ms | Deprecated (replaced March 2024) |
| TBT (Total Blocking Time) | Sum of main-thread blocking time in lab tests between First Contentful Paint (FCP) and Time to Interactive (TTI) | < 200 ms | Active (lab proxy metric) |
| INP (Interaction to Next Paint) | Latency of the slowest interaction across the entire page visit | < 200 ms | Active (current Core Web Vital) |
Not sure where your site actually stands on these metrics?
Our team runs a full Core Web Vitals audit – FID legacy data included – and hands you a prioritized fix list.
And if you want the full picture across all three Core Web Vitals, see our ultimate guide to improving Core Web Vitals in WordPress.
How to Measure FID and INP Before You Start Optimizing
You can’t optimize what you haven’t measured. The standard toolkit for this – the Chrome User Experience Report (CrUX), PageSpeed Insights, Lighthouse, and the browser’s Event Timing API – covers everything from real-world field data down to line-level diagnostics, and each tool answers a slightly different question about your 75th percentile score.
Reading PageSpeed Insights, Lighthouse, and CrUX Data Correctly
| Tool | Data Source (Lab / Field) | Best Use Case |
|---|---|---|
| PageSpeed Insights | Both – lab score plus real CrUX field data | Quick pass/fail check on a live URL |
| Lighthouse | Lab (simulated device and network) | Deep-diving TBT and long-task diagnostics before a fix |
| CrUX Report | Field (real Chrome users, 28-day rolling window) | Confirming your actual 75th-percentile INP in production |
Why the 75th Percentile Threshold Is the Number That Matters
Google scores Core Web Vitals at the 75th percentile of visits, not the average. In practice, that means if 75% of your recorded page visits register an INP under 200 milliseconds, the page passes – even if the remaining quarter of visits, often on older Android devices or slow connections, run slower. Chasing the average can hide exactly the segment of users who need the fix most.
Using the Event Timing API for Developer-Level Diagnostics
// Log every interaction slower than 200ms directly in the console

new PerformanceObserver((list) => {

  for (const entry of list.getEntries()) {

    const duration = entry.processingEnd - entry.startTime;

    if (duration > 200) {

      console.log(`Slow interaction: ${entry.name}`, duration.toFixed(1) + 'ms');

    }

  }

}).observe({ type: 'event', durationThreshold: 16, buffered: true });
On older browsers without native support, a lightweight polyfill keeps the same diagnostic code from breaking.
Core Optimization Techniques to Fix First Input Delay Fast
Five techniques account for most of the interactivity gains you’ll see in practice. Work through them roughly in this order:
- Break up long tasks into smaller async chunks
- Reduce JavaScript execution time (tree-shaking vs. code-splitting)
- Optimize interaction readiness with passive listeners and event delegation
- Debounce and throttle high-frequency event handlers
- Offload heavy work to web workers
Break Up Long Tasks Into Smaller Async Chunks
Any task that occupies the main thread for more than 50 milliseconds is classified as a long task, and it’s the single biggest cause of input delay. The fix is to chunk the work and yield control back to the browser between pieces:
- isInputPending() – checks if the user has attempted to interfere midway through the task, allowing you to pause the task and deal with the input before getting back to the background task execution.
- scheduler.yield() – the modern, purpose-built API for handing control back to the browser between chunks of a larger task.
- Chunking via setTimeout – the ubiquitous fallback method: wrap all remaining code into setTimeout(fn, 0), turning each chunk into an independent, shorter task.
Reduce JavaScript Execution Time – Tree-Shaking vs. Code-Splitting
| Technique | What It Removes / Delays | When to Use |
|---|---|---|
| Tree-shaking | Dead, unused exports from the final bundle | Always on – it’s a build-time cleanup step |
| Code-splitting | Nothing removed; defers non-critical code to load later | Large apps with routes or features not needed on first paint |
Tree-Shaking: Eliminating Dead Code
Tree shaking is a pre-compilation step during which static analysis of the import graph and removal of all exports not used by anything occurs. It’s supported natively by the major bundlers: Webpack, Rollup, and esbuild – each with slightly different aggressiveness around side-effect detection, so it’s worth checking your bundler’s output report after enabling it.
Code-Splitting: Loading Only What’s Needed
Code splitting retains all of the exports in your codebase while postponing the load of the entire chunk until the latter is actually needed:
// Only fetched when the user actually opens the settings panel

const SettingsPanel = React.lazy(() => import('./SettingsPanel'));
Optimize Interaction Readiness With Passive Event Listeners and Event Delegation
Two lightweight techniques eliminate the overhead of event handling without changing your business logic:
Passive Event Listeners Explained
document.addEventListener('touchstart', handleTouch, { passive: true });Marking a listener passive tells the browser upfront that it will never call preventDefault(), so scrolling and touch input aren’t held up waiting to find out.
Event Delegation as a Performance Pattern
// One listener on the parent replaces dozens bound to individual rows

list.addEventListener('click', (e) => {

  const row = e.target.closest('.list-row');

  if (row) handleRowClick(row.dataset.id);

});
Debounce and Throttle: Controlling High-Frequency Event Handlers
Search-as-you-type fields, scroll listeners, and resize handlers can fire dozens of times a second. This exact trade-off is a common talking point in developer communities – see the r/webdev discussion on optimizing First Input Delay – and the fix is almost always one of these two patterns.
| Debounce | Throttle | |
|---|---|---|
| Trigger Behavior | Waits until events stop firing, then runs once | Runs at most once per fixed interval, no matter how often events fire |
| Typical Use Case | Search input, form validation, autosave | Scroll listeners, resize handlers, drag events |
| Minimal Code Example | setTimeout(fn, delay) reset on every call | Track lastRun timestamp; skip calls inside the interval |
Offload Work to Web Workers
When a computation is simply too heavy to chunk on the main thread – parsing large payloads, image processing, complex data transforms – the only real fix is moving it off the main thread entirely. A small ecosystem of libraries makes this far less painful than hand-rolling postMessage plumbing.
Named Web Worker Libraries: Comlink, Workerize, and Workway
| Library | What It Does | Best For |
|---|---|---|
| Comlink | Removes postMessage boilerplate by proxying function calls to the worker | Teams already comfortable with async/await patterns |
| Workerize | Turns a normal module into a worker automatically at build time | Moving existing utility functions off the main thread with minimal rewrites |
| Workway | Lightweight wrapper for running one-off CPU-heavy functions in a worker pool | Isolated, compute-heavy tasks like parsing or image processing |
JavaScript refactors like these take real engineering time.
If you’d rather have it handled for you, our page-speed team ships these fixes directly into your codebase.
Advanced CSS-Level Fixes for Interactivity: content-visibility and will-change
- content-visibility: auto – delays rendering of offscreen content until it’s needed, making main-thread work faster on the first interaction.
- will-change – tells the browser in advance that an element will be animated/transformed, speeding up presentational changes.
Framework-Specific Fixes: React 18, Next.js, and Hydration-Blocking Interactivity
startTransition and useDeferredValue for Non-Blocking UI Updates
// Keeps the search input responsive while a large result list re-renders

startTransition(() => {

  setResults(filterLargeDataset(query));

});
// Lets React defer an expensive render until input settles
const deferredQuery = useDeferredValue(query);Reducing Hydration Cost in SSR Frameworks
Server-rendered pages often look interactive before the JavaScript that actually powers them has finished hydrating, which is a classic hidden source of input delay. Three remediation patterns address it directly:
- Partial hydration – hydrate only the interactive components and leave static markup as it is
- Streaming SSR – deliver HTML in parts so that the browser can start painting before receiving all the page content
- Selective hydration – allow React to hydrate whichever component is interacted with by the user
Next.js Hydration Optimization
- Dynamic import with ssr:false – defer hydration of components that aren’t needed for the first interaction.
- React Server Components – ship zero client-side JavaScript for content that never needs to be interactive.
- Streaming responses – use Suspense boundaries so slow data doesn’t block the rest of the page from becoming interactive.
Hydration Considerations in Nuxt and Other SSR Frameworks
The same principles apply outside the React ecosystem. Nuxt offers lazy hydration directives that delay a component’s hydration until it’s visible or idle, achieving the same goal as React’s selective hydration with framework-native syntax.
Layout Thrashing: The Hidden Cause of Poor Interactivity Scores
Layout thrashing happens when your code repeatedly forces the browser to recalculate layout by interleaving reads and writes to the DOM. Each forced synchronous layout adds directly to presentational delay.
| Anti-Pattern | Fix |
|---|---|
| Reading layout properties (offsetHeight, getBoundingClientRect) inside a loop | Read all values once, cache them, then perform writes afterward |
| Forcing reflow by alternating DOM writes and reads on the same frame | Batch reads and writes separately using requestAnimationFrame |
| Animating layout-triggering properties (width, top, left) | Animate transform and opacity instead, which don’t trigger layout |
Dynamic Imports and Bundler Mechanics: Webpack and Parcel
Both major bundlers support dynamic import() out of the box, but the configuration differs slightly. Webpack and Parcel both split the imported module into its own chunk automatically:
// Webpack - chunk name via magic comment

import(/* webpackChunkName: 'chart' */ './Chart').then((m) => m.render());

// Parcel - zero-config, no magic comments needed

import('./Chart').then((m) => m.render());
WordPress-Specific Fixes for First Input Delay
Plugin-Based Fixes for Non-Developers
- Script-delay / execution-delay plugins
- Lazy-load plugins for images, video, and iframes
- Minification and combination plugins for CSS/JS
Theme and Code-Level Fixes for WordPress Sites
- Defer non-critical scripts in functions.php – use the wp_enqueue_scripts hook and apply the defer attribute to non-critical content.
- Inline critical CSS – extract above-the-fold styles into the head so the page paints before the full stylesheet loads.
- Disable render-blocking plugins on the front end – audit for plugins injecting synchronous scripts and switch them to async or defer.
How Poor FID and INP Impact Bounce Rate, Conversions, and SEO Rankings
Slow, unresponsive interactions compound quickly: visitors who tap a button and feel nothing happen tend to bounce, and Google factors Core Web Vitals into its ranking signals on top of the direct conversion hit. Sites that bring their pages inside the good INP threshold consistently see lower bounce rates on high-intent pages like checkout and lead forms – which is exactly the layer our Core Web Vitals service is built to fix end-to-end, from measurement through implementation. If Largest Contentful Paint is also dragging on the same pages, our guide to improving LCP in WordPress covers that fix in the same depth.
Ready to stop losing conversions to slow interactivity?
Book a walkthrough of your site’s current Core Web Vitals and get a prioritized action plan.
Fixing First Input Delay and INP rarely comes down to one silver-bullet change – it’s the combination of JavaScript chunking, CSS-level tuning, and framework-specific hydration fixes covered above that moves the needle. If you’d rather skip the trial and error, you can get in touch through our consultation page and we’ll walk through exactly where your site is losing responsiveness. You can also browse more of our performance work on the Raja Toqier homepage.
Frequently Asked Questions About First Input Delay
A good FID score is under 100 milliseconds at the 75th percentile of page visits. Since FID has been replaced by Interaction to Next Paint, the equivalent modern target is an INP under 200 milliseconds – that’s the number Google actually uses to grade responsiveness today.
No. Google fully replaced FID with Interaction to Next Paint as an official Core Web Vital in March 2024. FID is no longer collected or scored, hence, INP, along with LCP and CLS, is what measures the interactivity aspect of your Core Web Vitals signal.
Interaction to Next Paint (INP) replaced First Input Delay. Unlike FID, which measured the initial interaction on a web page, INP measures the slowest interaction on an entire visit, offering a much more comprehensive overview of performance.
PageSpeed Insights is the fastest free option – it pulls real CrUX field data alongside a Lighthouse lab score for any public URL. Search Console’s Core Web Vitals report also shows INP trends across your whole site at no cost.
Plugins can be helpful in solving the problem – but while script delay, lazy loading, and minifying plugins will solve a significant percentage of the most typical problems, they are incapable of resolving many deep-seated issues, such as optimizing your theme JavaScript files or render-blocking third-party embeds.